Polarity
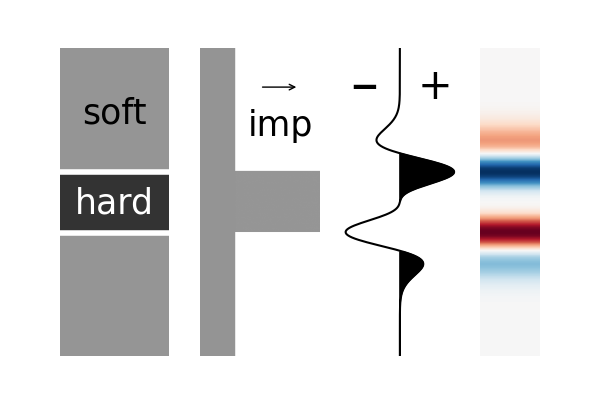
This applet generates polarity cartoons. What on earth is a polarity cartoon? Read this blog post.
Use the form below to make a quick cartoon (right-click > copy image), or scroll down to read about the API.

Use the API
Quick URL for PNGs:
https://app.scienxlab.org/polarity.png
There's a different endpoint for SVGs:
https://app.scienxlab.org/polarity.svg
Example URL with the default values:
The parameters (defaults in bold):
- layer — kind of layer in the earth model —
hardorsoft. - polarity — normal (US, SEG) or reverse (European) polarity —
normalorreverse. - freq — the frequency of the wavelet used —
lo,med,hi, orvhi. Spellings 'low' and 'high' are allowed. - phase — the phase of the wavelet used — integer, degrees, default 0.
- style — variable density synthetic or simple ramp —
synorramp. - cmap — with the exception of the custom
petrelcolourmap, only matplotlib colourmaps are allowed, seematplotlibhelp. E.g.RdBu,RdGy,seismic,grayorseismic. You can reverse any colourmap by appending_r, e.g.gray_r.
Get the code
You can get the code here. The script has a command line interface, or use it as a module in your own code.
About this app
The cartoons are matplotlib plots generated by a Python Flask web app.
 Images generated by this tool are free from copyright. Do whatever you like with them.